Oftentimes, we want to measure the quality of care of a give hospital or health care system. The easiest way of doing this is to measure the quality of care received by patients who go to that hospital. These patients, however, may attend multiple hospitals during they year. Further, if quality of care includes avoiding hospitalizations, we need to identify not only patients who had a hospital admission but patients who were at risk of going to that hospital if a preventable admission occurred.
One way to model quality of care is to use catchment areas. Catchment areas are typically aggregations of geographic units. For instance, hospital service areas (HSAs) are aggregations of ZIP codes. However, previous research has shown that HSA-based catchment areas only capturing 50% to 80% of hospital admissions for their given population. One could use larger geographic regions—such as hospital referral regions (HRRs)—but then one is susceptible to assigning patients to hospitals over which they are unlikely to have responsibility for their care.
My previous research on the hospital wage index (see here and here) proposed assigning a weighting of the geographic units While that approach aimed to measure geographic variation in wages where data was available by geography rather than by person, an interesting paper by Falster, Jorn and Leyland (2017) proposes a different approach using individual patient data and a methodology known as multiple-membership multi-level model multi-level.
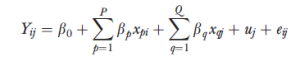
To explain this model, consider first a standard approach whereby where I people are clustered within J hospitals or HSAs.
Yij is the outcome, xpi are the regression parameters for P person-level variables, and xqj are the regression parameters for Q hospital-level variables. This multilevel model captures the effects of clustering by allowing both regression parameters and error terms to exist at different hierarchical levels.
A multiple-membership multilevel model extends this approach by allowing a weighted structure for each of the hospital-level components as follows:
![]()
Here, the superscripts represent the different model hierarchy levels. Faster and co-authors apply this model to date on preventable hospitalizations in NSW Australia using weighted hospital service area networks (weighted-HSANs). The authors contend that:
Between-hospital variation in rates of preventable hospitalization was more than two times greater when modeled using weighted-HSANs rather than HSAs. Use of weighted-HSANs permitted identification of small hospitals with particularly high rates of admission and influenced performance ranking of hospitals, particularly those with a broadly distributed patient base.
While this approach is a significant improvement for an academic setting, it is problematic to operationalize in terms of quality improvement. In order to improve quality, hospitals need clear rules regarding the patients to which it is attributed. While the authors compellingly argue that multiple-membership multilevel models do a better job mof measuring quality retrospectively than would be the case using HSAs alone, operationalizing the use of weighted HSANs in practice would be more difficult due to the model complexity. Nevertheless, this approach clearly highlights the challenges of using HAS-based catchment areas to measure quality of care.
Source:
- Falster, Michael O., Louisa R. Jorm, and Alastair H. Leyland. “Using Weighted Hospital Service Area Networks to Explore Variation in Preventable Hospitalization.” Health Services Research (2017).